Draft disparity (cont'd).
Wednesday, January 24, 2007
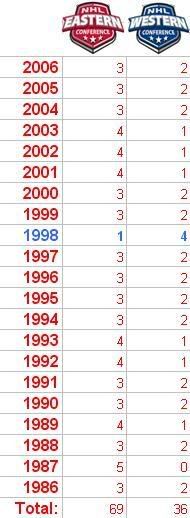
Waking up this morning, the first e-mail I found in my mailbox was a notification for Drew's comment in the last post, asking me how the draft comparison between the two conferences would look if instead of only comparing how many #1 picks each conference had the past 21 years, I compared the total of top 5 picks for each conference over that same time.
I'd just like to take this time to say that Wikipedia is awesome beyond compare.
In any event, this is what I found:
I'd just like to take this time to say that Wikipedia is awesome beyond compare.
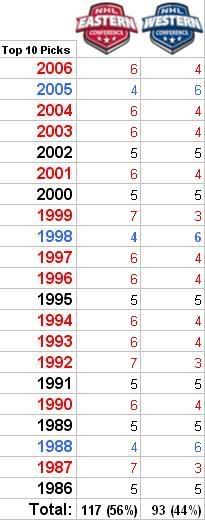
In any event, this is what I found:
Once again, these results ignore any variables such as trades for draft pick placement, as well as relocation and expansion (such as the Nordiques moving West, or the Blue Jackets' and Wilds' obligatory top five pick during their shared first year).
Even so, how can you ignore something like this? About 65% of top five picks over the past two decades have gone to the East? This brings in to question a lack of parity in the Eastern Conference, where teams that are bad are bad (why hello there, 2006-2007 Philadelphia Flyers), while bad teams in the Western Conference are, while bad, nowhere near as apparently abysmal as their East counterparts.
Yes, I know, the lottery could very well be changing things around, and some overall worst teams could actually be in the West each of those seasons that I checked the draft out for, but were placed elsewhere in the draft due to the lottery. But come on; even with that in mind, the discrepancy between total picks for each conference is a pretty wide margin, in my opinion.
Anyway, now I'm off to see if I can't make this apartment look a little more spic and span. I'm not really sure if there was any real revelations behind comparing top pick balance (imbalance) between the conferences, but it still has me wondering about a thing or two. Hmm.
Edit (5:20 PM EST): I've decided to take it a step further and checked the top 10 picks over this timespan, and which conference got the most. The West still trails, however they manage to cut the percentage difference from 65/35 to 56/44! I think if I took it any further, though, there'd just be no real point.
Labels: nhl draft, schedule, statistics


Crap, I was hoping you'd find something else. Oh well, at least I gave you something to do this morning!
I suppose the next thing to look at is to take "winning the lottery" out of the equation and look strictly at end of regular season points. Even that won't skew the results more than a couple percentage points, though.
So the question you're raising is, "why the disparity?"
I think it's a good one. Does travel have anything to do with it? Maybe. Even bad teams in the West have people coming into their building from 1,500 miles away so maybe they pick up a few extra points that way?
Why I think it would be more the other way? Expansion teams since 1990. San Jose, Anaheim, Minnesota, Nashville, and Columbus are all in the West. Florida, Tampa Bay, and Atlanta in the East. More new/bad teams in the West you'd think would equal higher draft position. Apparently not.
I think you've stumbled upon an interesting anomaly, Michael. I'm not sure how important it is overall. I suppose that depending on what you/we/anyone ascribes as the reason will determine how important it is.
Now get to cleaning!